
graph in Physics
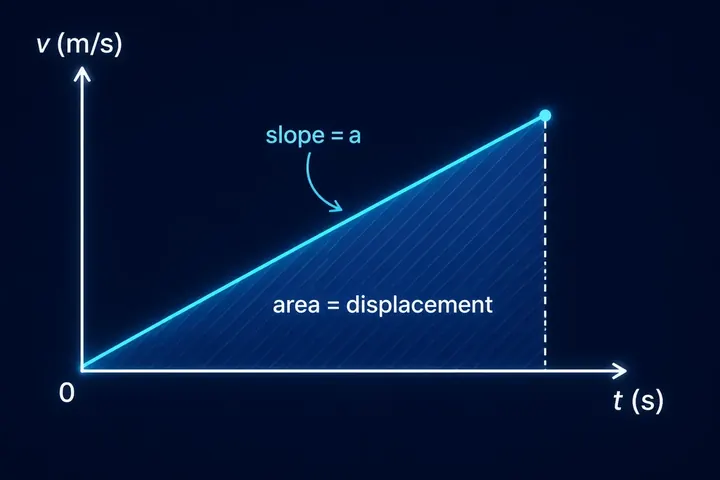
A plot on two axes showing how one physical quantity changes with another.
In physics, graphs reveal relationships quickly. The slope and the area under a graph often represent physical quantities, like velocity or displacement.
Meaning in your language
ग्राफ (आलेख) — दो अक्षों पर यह दिखाना कि एक राशि दूसरी के साथ कैसे बदलती है
भौतिकी में ग्राफ संबंधों को तुरंत प्रकट कर देते हैं। ग्राफ की ढाल और उसके नीचे का क्षेत्रफल प्रायः भौतिक राशियों को दर्शाते हैं, जैसे वेग या विस्थापन।
رسم بياني: تمثيل على محورين يبين كيف تتغير كمية فيزيائية مع أخرى
في الفيزياء تكشف الرسوم البيانية العلاقات بسرعة. وكثيرًا ما يمثّل الميل والمساحة تحت المنحنى كميات فيزيائية، مثل السرعة أو الإزاحة.
graphique : représentation sur deux axes de la variation d'une grandeur en fonction d'une autre
En physique, les graphiques révèlent rapidement les relations. La pente et l'aire sous la courbe représentent souvent des grandeurs physiques, comme la vitesse ou le déplacement.
grafik: gambar pada dua sumbu yang menunjukkan perubahan satu besaran terhadap besaran lain
Dalam fisika, grafik mengungkapkan hubungan dengan cepat. Kemiringan dan luas di bawah grafik sering mewakili besaran fisika, seperti kecepatan atau perpindahan.
图像:在两条坐标轴上表示一个物理量随另一个量变化的图
在物理学中,图像能迅速揭示各量之间的关系。图像的斜率和图线下的面积常代表物理量,例如速度或位移。
Examples
- The slope of a position-time graph gives the velocity of the body.
- A doctor reads an ECG graph of the heart's electrical signal against time.
Everyday meaning
a drawing with lines, bars or points that shows how numbers or amounts change or compare